Baby Names Lab
This is a lab activity, not an assignment. Therefore, it's not required that you complete it or hand it in. However, the concepts in this lab will be useful for completing the homework assignments (and will be useful for exams down the road), so I'd encourage you to put in a serious effort on it in class, and to consider finishing any remaining parts outside of class.
Goals: Practice using files and nested lists. See how we can use the matplotlib library to create plots in Python.
Setup
Log into a lab computer, mount COURSES, and navigate to your STUWORK directory. Look back at the lab from the first day of class or get help from Anna or Rachel if you need a reminder on how to complete these steps.
Create a folder in your STUWORK directory called lettersLab. Open VSCode, and drag the lettersLab folder
into the VSCode window. Download the
starter code
and move all files into your new folder.
One additional setup note: if you're running this on your own computer after class, you'll likely get an error that says something about matplotlib not being installed. You can fix this by running the following command in the terminal
pip3 install matplotlib
If that doesn't work, try pip install matplotlib. If that still doesn't work, reach out for help and in the meantime
work on one of the lab computers that already has matplotlib installed.
Part 1: Counting letters
The folder you downloaded contains several data files. These files contain the top 100 baby names assigned per gender for several birth years both in the US (source: Social Security Administration) and in New Zealand (source: Dept. of Internal Affairs, Te Tari Taiwhenua).
For the first part of the lab, you'll focus on counting how often each letter appears in a string. Then, we'll read data from a file to apply this technique to popular baby names for the different location and years. Then, later in the lab we'll explore how to display this data visually.
countLetters
You'll write a helper function countLetters. This function will be called by countLettersInFile and the idea is that
countLettersInFile function will count all the letters in a file by calling countLetters for each name in the file.
countLetters will take two parameters, a string and a list that contains the counts so far. It should return a new list
that contains the sum of the counts for the old list and the counts for the new string.
For example, if I've initalized a list of twenty-six 0's and called this variable myList, then I can do the following:
>>> myList
[0, 0, 0, 0, 0, 0, 0, 0, 0, 0, 0, 0, 0, 0, 0, 0, 0, 0, 0, 0, 0, 0, 0, 0, 0, 0]
>>> updatedList = letterCounter.countLetters("anna", myList)
>>> updatedList
[2, 0, 0, 0, 0, 0, 0, 0, 0, 0, 0, 0, 0, 2, 0, 0, 0, 0, 0, 0, 0, 0, 0, 0, 0, 0]
>>> updatedAgain = letterCounter.countLetters("anna", updatedList)
[4, 0, 0, 0, 0, 0, 0, 0, 0, 0, 0, 1, 0, 3, 0, 0, 0, 0, 0, 0, 0, 0, 0, 0, 0, 0]
After the first call to countLetters, the count at index 0 is 2 (for the 2 "a"'s in "anna") and the count at index
13 is 2 (for the 2 "n"'s in "anna"). Then I call countLetters("alan", updatedList), which returns a newly updated list
combining the letter counts for "anna" and "alan". Please ask for help if you have questions about this.
First, before you write any code on the computer, write pseudocode on a piece of paper for a function that will count the number of times each letter appears in a string. Then, modify your pseudocode to account for these complexities:
- Lowercase and uppercase letters should both count towards the overall count for a letter.
- Not all characters in the string will be letters (for names, think apostrophe or hyphens) but you should only count letters.
Once you're satisfied with your pseudocode, type it up in Python. Add your code to letterCounter.py and find the
function stub for countLetters.
Testing countLetters
main already contains one test for countLetters. Run the code to see if it produces the expected results. If it does,
add at least 2 more test cases to make sure the function behaves as expected. If it doesn't go back and debug. Some tips
for debugging are:
- Make a hypothesis about what could be causing the behavior you're seeing.
- Add print statements or use the VSCode debugger to test your hypothesis. If you're using print statements, make sure to include some text in the print statement so that you know what variable is being printed. Whether you're using print statements or the debugger, make sure that the variables match what you expect.
- Try to understand why the bug is occurring. This helps to strengthen your mental model of programming and may make it easier to avoid or solve similar problems in the future.
Part 2: Reading from a file
Now, we'll read data from a file. Write out pseudocode for a function that will read lines from a file and count the
letters in each line, finally returning a list with the total count of each letter. This function should call countLetters.
See below ("Code tips") for example syntax of how to read a file and loop through the lines.
As you're writing your pseudocode, take a look at the data files to see how the data is formatted.
Again, once you're satisfied with your pseudocode, write the code in Python and test it. You should put this code in the
function countLettersInFile.
I've also included a file smallTestCounts.txt that just contains 6 names. The returned list of counts for that file should
look like:
>>> counts = letterCount.countLettersInFile("smallTestCounts.txt")
>>> counts
[3, 0, 0, 0, 4, 0, 2, 1, 1, 0, 0, 1, 3, 1, 1, 0, 0, 5, 0, 5, 2, 1, 0, 0, 2, 0]
Code tips
To read in a file by line, use this syntax:
with open(filename, 'r', encoding='utf-8') as file:
    for line in file:
        print(line) # this prints the line. Replace with whatever you'd like to do instead
There are also other ways of reading in a file if you want to store its lines and iterate through them many
times. You don't need to do this here, but the readlines method is a good one to check out, if you ever need
this functionality in the future.
The method str.split may be useful. If you need a refresher on how this method works, in the interpreter
(type python3 in the terminal), you can run help(str.split). (Alternatively, you can look back at the
Runestone Section that discusses split.
Then, experiment in the interpreter to
to see how to use split.
Part 3: Plotting
Bug alert!! There's one typo to fix in plotList. Change the final line to plt.show() or otherwise your
graph will immediately disappear after being created.
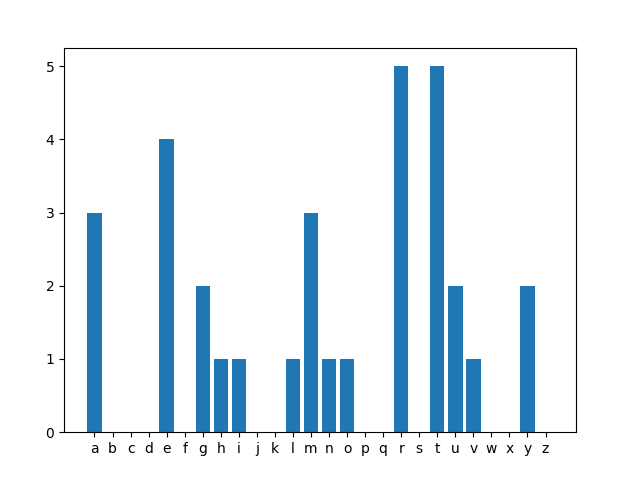
Once your functions are working, try calling the plotList function with the list that's returned by countLettersInFile.
You should see a graph popup that shows you the counts for each letter. Here's an example of the graph that shows up for the
smallTestCounts.txt file:
>>> counts = letterCounter.countLettersInFile("smallTestCounts.txt")
>>> letterCounter.plotList(counts)
Extra time?
There are lots more analyses you can do on this dataset! Here are some ideas.
Calculating frequencies
We'd like to be able to compare how letter frequency in names changes over time. One way to do this would be simply to compare the count of "a" from, say, 1900, to the count of "a" in 2008. But what if names also got longer during this timeframe? Instead, we should compare the proportion of "a"'s in 1900 to the proportion of "a" in 2008.
To do this, write a function calculateFrequencies that takes a list as a parameter and returns a list that
has proportions, rather than raw counts. For example, if my original list was [2, 3, 1, 2] my new list would be
[0.25, 0.375, 0.125, 0.25] because there are 8 total occurences in the list. Your function should not be destructive
(i.e., don't modify the list that is passed in).
Test your function and then try calling plotList with the list that's returned. You should see the same pattern as for
the original list, but with a different y-axis. Why is this?
Comparing frequencies
There's an XKCD comic that compares the frequency of letters in normal English text with the frequency of letters in car names. For example, the comic shows that the letter "x" is overrepresented in car names relative to other English text.
We'll make something similar that will allow us to compare relative frequencies over time (e.g., 2008 vs 1900) or place
(USA vs New Zealand). To do this, write a function compareFrequencies that takes two filenames as parameters, and returns
a list of 26 items. The nth item should be positive if the nth letter is more common in the first file than the second,
and negative if the nth letter is more common in the second file than the first. More specifically, the value of the nth
item should be the ratio of the frequency in the first file to the frequency in the second file.
It will help to write out pseudocode on paper first!
When you test your algorithm, you may run into a problem: the function crashes if there are 0 counts of a particular letter
in one of the files. Modify countLettersInFile to add 1 to every letter count. This is known as smoothing: it helps "smooth"
out irregularities in the data, such as counts being 0 due to not having a large enough collection of names, while still preserving
big differences in counts that come from the data.
After writing compareFrequencies, call plotList to make the plot. If you aren't seeing much detail (e.g., if only one of the
values is very large), call plotList with two parameters: the list, followed by True. Adding the second parameter will make
plotList use y-axis limits of -10 and 10.
Explore the data files and see if you notice any interesting trends!
Even more ideas
- The files include the number of babies given a particular name. Modify your functions from Part 1 so that
countLettersInFiletakes an additional parameter, a boolean. If the parameter is False, behave as we did previously. But if the parameter is True, count each letter in a name n times if there were n babies born with that name. For example, if "Erin" occured 500 times, I would add 500 to my count of "e", 500 to my count of "r", and so on. You may also want to modifycountLettersto take an additional parameter as well. - You might be interested in plotting other lists. For example, a list comparing the average number of characters in names from different eras. Make a copy of the plot function, rename it, and try to modify it so that it doesn't require the input list to contain 26 items.
- The files include M/F for gender assigned at birth. Write a function that only counts letters for the M names or for the F names. Try to reuse code as much as possible, calling functions rather than copying/pasting code.
Anna's acknowledgements
This lab was adapted from one by Anna Rafferty. Thanks for sharing!